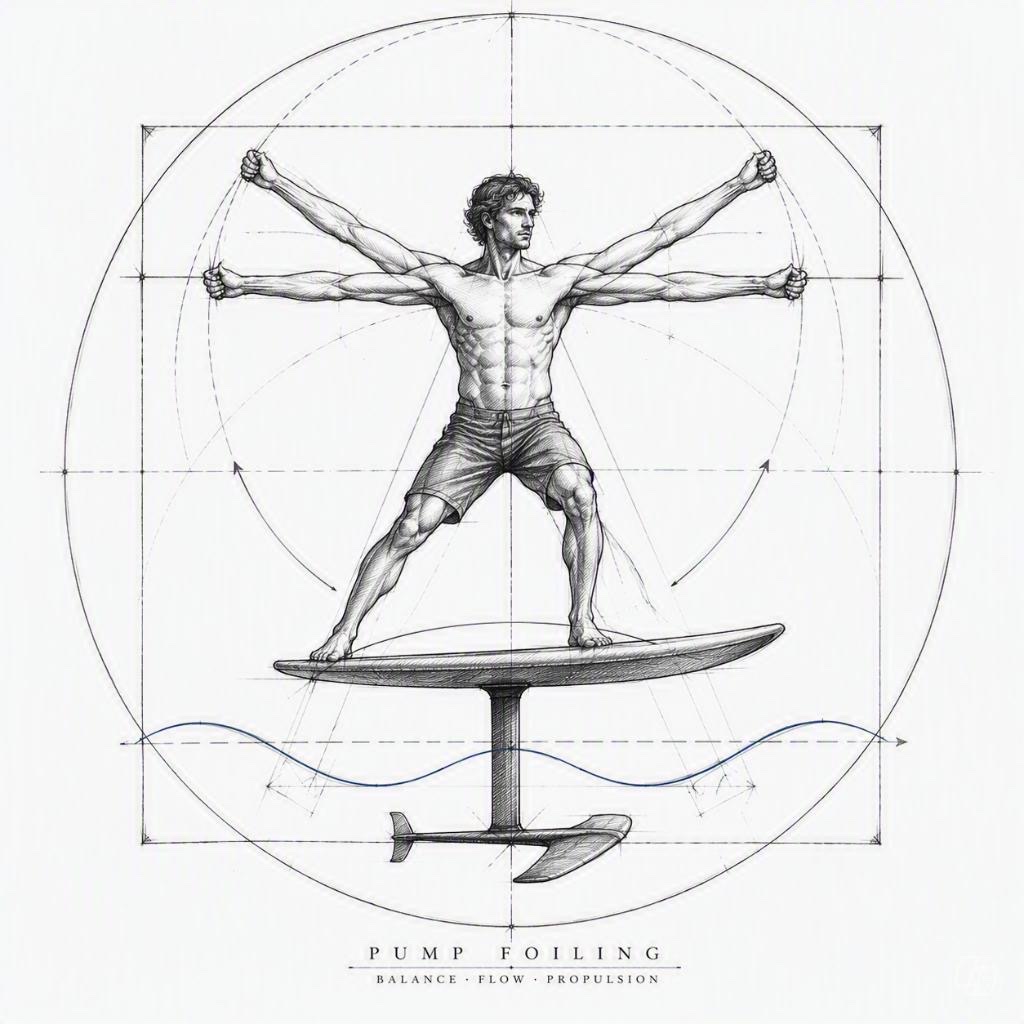
Panels A–E
Five panels on the right show animation and charts. They are coupled: phase, operating point and setup apply everywhere at once.
Panel A — foil side view
Animated side view of the foil in the pump cycle.
| Element | Meaning |
|---|---|
| Heave | Vertical motion of the front wing |
| Force vectors | Lift, drag, thrust |
| Submersion depth | Mast in the water (header) |
| Rig inset | Board, feet, knee bend |
| Head photo | optional, visual only — upload under Rider profile |
Transport controls below the panel: play/pause and phase scrubber.
What to watch: On the downstroke lift tilts forward → thrust. On the upstroke you get drag.
Panel B — heave and angle of attack
Shows 3 pump cycles (seamless loop):
- Black: heave y(t)
- Red: effective angle α_eff(t)
The vertical line follows the animation in panel A. Reduced frequency k appears in the header.
What to watch: Large α swings → stall risk; reduce frequency or amplitude.
Panel C — lift-to-drag vs angle of attack
Front wing polar only (no mast, fuselage or rear wing):
- Black point: steady trim at analysis speed
- Red point: unsteady angle from the pump cycle
Header shows AR and t/c of the front wing.
Rig vs front wing
Panel C is the main wing only. Panel D shows whole-rig L/D.
Panel D — lift-to-drag vs speed
Whole-setup lift/drag vs speed (km/h):
| Zone | Meaning |
|---|---|
| Take-off | below this the foil does not fly |
| Cruise | typical pump and glide range |
| High speed | mast and fuselage drag rises; Vmax = useful steady end (trimmable, L/D ≥ 40 % of peak) |
- Marker = analysis speed (best glide or Vmax depending on goal)
- Vmax line (Advanced/Pro) = high-speed end on the curve
- Second marker = mean pump speed (when sustaining)
- Dashed curves = saved comparison setups
The panel D note lists take-off, cruise window and Vmax in km/h.
Panel E — drag shares
Bar chart at the analysis operating point:
| Share | Source |
|---|---|
| Front wing | profile, induced, wave |
| Mast | wetted mast (no lift) |
| Interference | mast–fuselage transitions, joints |
| Rear wing | stabilizer incl. shim |
| Fuselage | link tube |
| Spray | mast piercing the surface |
What to watch: When comparing setups, panel E shows where savings come from — not just whether L/D rises.